Image Details
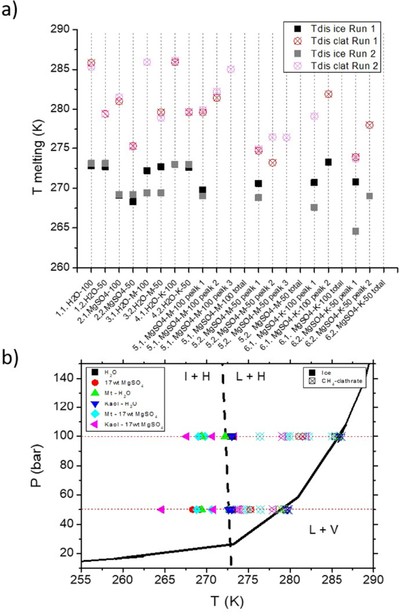
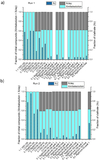
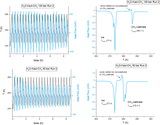
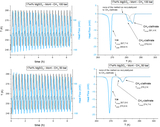
Caption: Figure 2.
(a) Ice and CH4 clathrate melting temperatures, and (b) H2O–CH4 phase diagram with the experimental temperatures shown in panel (a). L: liquid aqueous solution, I: water ice, H: CH4-clathrate hydrate, V: CH4 gas. The composition of each set can be seen in Table 1.
Other Images in This Article
Show More
Copyright and Terms & Conditions
© 2026. The Author(s). Published by the American Astronomical Society.
Copyright ©
2026 Astronomy Image Explorer. All Rights Reserved.