Image Details
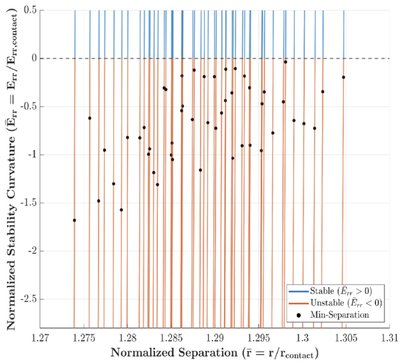
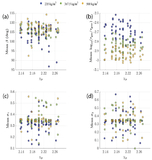
Caption: Figure 10.
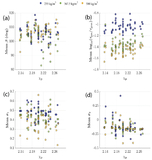
Normalized stability curvature ﹩{\bar{E}}_{\mathrm{rr}}﹩ as a function of the normalized separation ﹩\bar{r}﹩. The normalization factor rcontact is the sum of the long semiaxes for each specific lobe shape combination, ranging between 17.94 and 19.03 km. The solid curve denotes the transition from stable (blue) to unstable (orange) energetic stability (D. J. Scheeres 2009). The black dots represent the initial separations for the minimum-separation orbits, which are initialized in an unstable regime.
Other Images in This Article
Copyright and Terms & Conditions
© 2026. The Author(s). Published by the American Astronomical Society.
Copyright ©
2026 Astronomy Image Explorer. All Rights Reserved.