Image Details
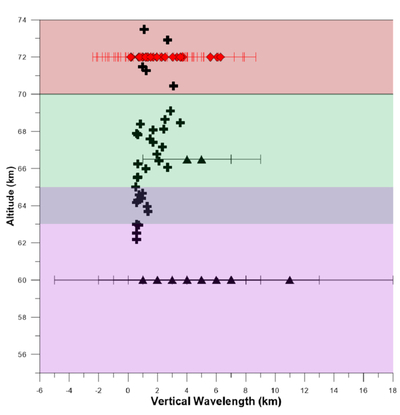
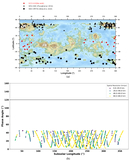
Caption: Figure 16.
Vertical wavelength results plotted against altitude. Red diamonds represent the results of this work’s Akatsuki/UVI waves, black triangles represent the results of J. E. Silva et al. (2024), and black plus signs represent the measurements by R. Mori et al. (2021). The shaded areas show the approximate altitude windows on Venus's atmosphere sampled by each observing wavelength range probes. Once again, red represents Akatsuki/UVI based on N. I. Ignatiev et al. (2009), and the green and purple areas represent the two altitude ranges of J. E. Silva et al. (2024; with an overlap between 63 and 65 km shown in a bluish hue).
Other Images in This Article
Show More
Copyright and Terms & Conditions
© 2026. The Author(s). Published by the American Astronomical Society.