Image Details
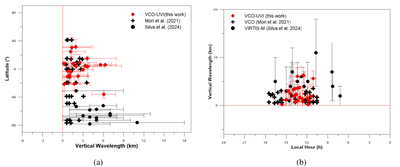
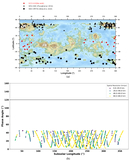
Caption: Figure 15.
Vertical wavelength results plotted against (a) latitude and (b) local time. Red diamonds represent the results of this work’s Akatsuki/UVI waves, black circles represent the results of J. E. Silva et al. (2024), and black plus signs represent the results for R. Mori et al. (2021).
Other Images in This Article
Show More
Copyright and Terms & Conditions
© 2026. The Author(s). Published by the American Astronomical Society.
Copyright ©
2026 Astronomy Image Explorer. All Rights Reserved.