Image Details
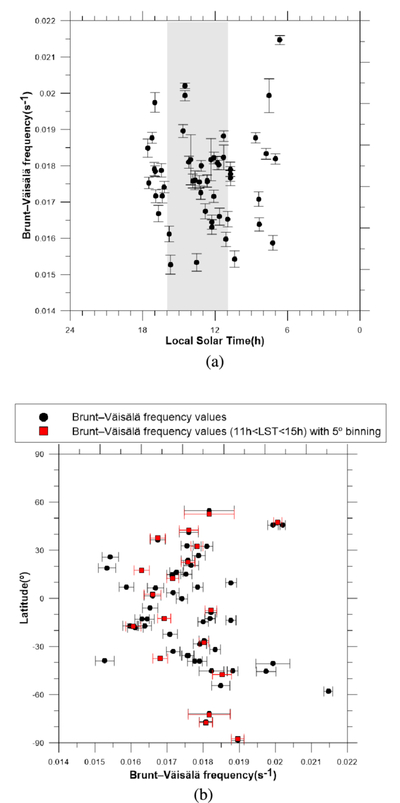
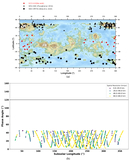
Caption: Figure 14.
(a) Estimated N values vs. the local time coordinate. Error bars represent the propagated uncertainty σN associated with each calculation of N. The gray area represents the values within 11 and 16 hr, where all our waves are located. Only these values were considered for the means by 5° of latitude. (b) Estimated N values vs. latitude. Values shown in black correspond to individual measurements, while values shown in red correspond to an average of the values within 11 and 16 hr of LST per bands of 5° of latitude. These averaged values were used for vertical wavelength calculations according to the latitude of each wave. Black error bars represent the propagated uncertainty σN associated with each calculation of N, and red error bars show the uncertainty of the bin-averaged value, derived from the uncertainties of the individual measurements included in that bin.
Other Images in This Article
Show More
Copyright and Terms & Conditions
© 2026. The Author(s). Published by the American Astronomical Society.