Image Details
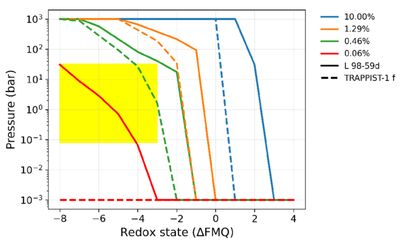
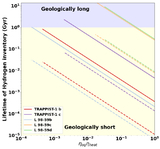
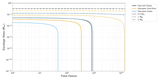
Caption: Figure 8.
Colored curves show the equilibrium surface pressure from the outgassing–escape balance as a function of mantle redox state (ΔFMQ) for four ﹩{m}_{{{\rm{H}}}_{2}{\rm{O}}}﹩ (10.00%, 1.29%, 0.46%, 0.06%). Solid lines correspond to L 98-59,d; dashed lines correspond to TRAPPIST-1,f. The yellow box highlights the observationally relevant regime bounded below by 0.1 bar (detectability threshold for a visible atmosphere; J. De Wit & S. Seager 2013) and above by P100Myr. Here we fixed ﹩{\chi }_{{{\rm{CO}}}_{2}}﹩ = 600 ppm and χS = 1000 ppm using MORB volatile inventory (F. Gaillard & B. Scaillet 2014).
Other Images in This Article
Show More
Copyright and Terms & Conditions
© 2026. The Author(s). Published by the American Astronomical Society.