Image Details
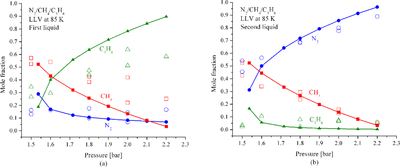
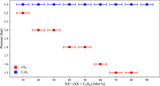
Caption: Figure 7.
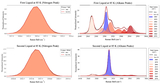
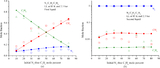
Compositions of first and second liquids in CH4–C3H8–N2 LLV systems. The compositions calculated from experimental Raman spectra are represented by the open points, while the PC-SAFT calculations are shown as filled points. The x-axes show the pressure (bars) of the LLV equilibrium. The y-axes show the mole fraction of each species in the first or second liquid. Methane concentrations are shown in red, propane in green, and nitrogen in blue.
(The data used to create this figure are available in the online article.)
(The data used to create this figure are available.)
Other Images in This Article
Show More
Copyright and Terms & Conditions
© 2026. The Author(s). Published by the American Astronomical Society.
Copyright ©
2026 Astronomy Image Explorer. All Rights Reserved.