Image Details
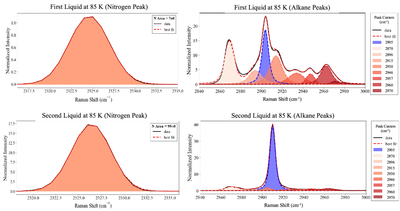
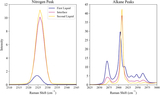
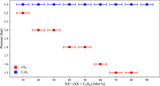
Caption: Figure 6.
Examples of Voigt profiles for the nitrogen peak (2325 cm−1) and the alkane region (2840–3000 cm−1) for the first and second liquids of a methane–propane–nitrogen LLV. The methane peak is shown in blue, while the propane peaks are plotted in a red gradient.
(The data used to create this figure are available in the online article.)
(The data used to create this figure are available.)
Other Images in This Article
Show More
Copyright and Terms & Conditions
© 2026. The Author(s). Published by the American Astronomical Society.
Copyright ©
2026 Astronomy Image Explorer. All Rights Reserved.