Image Details
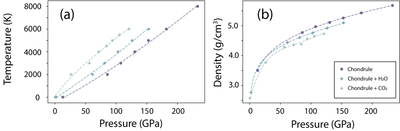
Caption: Figure 1.
Hugoniot curve of chondrule (A. Saurety et al. 2025), a hydrated chondrule (A. Saurety & R. Caracas 2025), and the carbonated chondrule (this work) in the pressure–temperature phase space (a) and in the density–pressure phase space (b). Data are fitted using spline interpolation for a visual guide.
Other Images in This Article
Copyright and Terms & Conditions
© 2026. The Author(s). Published by the American Astronomical Society.
Copyright ©
2026 Astronomy Image Explorer. All Rights Reserved.