Image Details
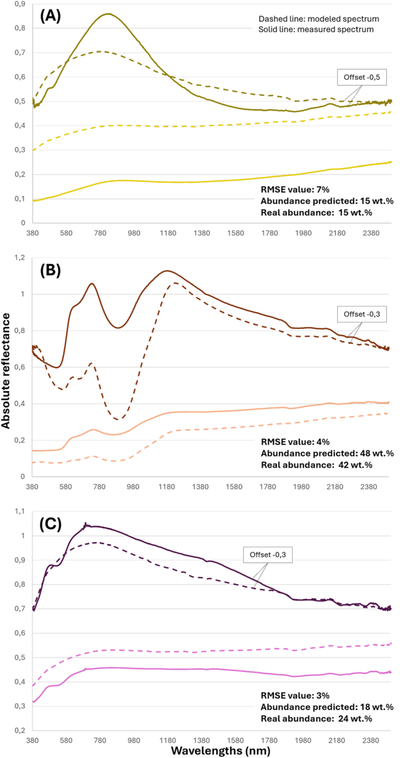
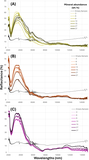
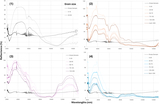
Caption: Figure 6.
Comparison of measured and modeled spectra (selected based on the minimum RMSE value) for (a) ilmenite/LHS with 15 wt% mineral, (b) hematite/LHS with 42 wt% mineral, and (c) spinel/LHS with 24 wt% mineral mixtures with bulk grain sizes (<250 μm), under a fixed viewing geometry (i = 30°, e = 0°). Modeled spectra are shown with dashed lines, while measured spectra are shown with solid lines. Dark colors represent continuum-removed spectra, and light colors represent reflectance spectra. Vertical offsets were applied for clarity and are indicated in the graph.
Other Images in This Article
Copyright and Terms & Conditions
© 2025. The Author(s). Published by the American Astronomical Society.
Copyright ©
2025 Astronomy Image Explorer. All Rights Reserved.