Image Details
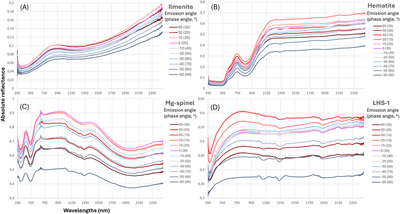
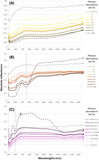
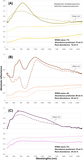
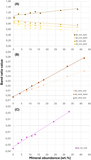
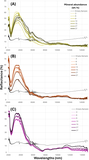
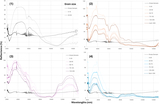
Caption: Figure 3.
Spectra of (a) ilmenite, (b) hematite, (c) spinel, and (d) LHS-1 simulant as a function of the emission angle acquired with an incidence angle of 30° and a maximum grain size of 20 μm. The shades of red correspond to positive emission angles when the sensor is placed on the same side as the light source on the goniometer (backscattering). The shades of blue correspond to negative emission angles when the sensor is placed on the opposite side of the light source (forward scattering). The lighter the color, the closer the emission angle is to 0° (i.e., the closer the sensor is to the nadir). The emission angle at 0° is distinguished by its purple color. Measurements of ilmenite spectra at a phase angle of 10° were not included, due to limitations in the setup.
Other Images in This Article
Copyright and Terms & Conditions
© 2025. The Author(s). Published by the American Astronomical Society.