Image Details
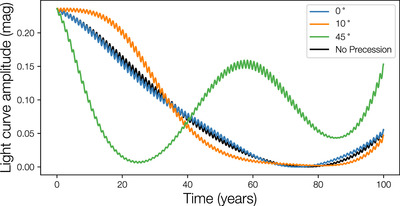
Caption: Figure 7.
The change in Hi’iaka’s light-curve amplitude over time. Using the integrations similar to those shown in Figure 6, we calculate the light-curve amplitude using Equation (1) from Hastings et al. (2016). Note that the x-axis is different than Figure 6. Axis ratios were chosen to be similar to other solar system objects at similar size, as well as approximately matching the light-curve amplitude found in the literature (Hastings et al. 2016). The no-precession case is found by taking a fixed pole direction. The fast variations in these functions are due to Earth’s heliocentric orbit. Even for small obliquities, the light curve evolves significantly differently than the no-precession case. As in Figure 6, we find that the aligned case (0°) still shows precession and slightly different light-curve evolution when compared to the no-precession case. Long-term monitoring of Hi’iaka’s light curve may permit direct measurement of its spin pole over decadal timescales.
Other Images in This Article
Copyright and Terms & Conditions
© 2024. The Author(s). Published by the American Astronomical Society.