Image Details
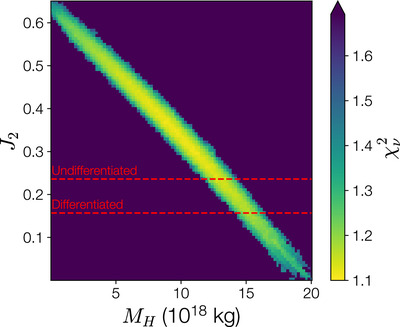
Caption: Figure 3.
The joint Haumea J 2–Hi’iaka mass posterior distribution. Instead of displaying the density of sampled points as in Figure 1, we show the maximum fit quality (as measured by reduced χ 2) in a small bin. Bins without any sampled points, indicating extremely poor-quality fits, were set to the minimum bin value, although the true value is likely much worse. We find that the best fit with ﹩{\chi }_{\nu }^{2}\sim 1.1﹩ has a p-value of 0.23, meaning there is a 23% chance that random chance would produce a worse fit. A ﹩{\chi }_{\nu }^{2}\sim 1.25﹩ corresponds to a p-value of 0.05. Dashed red lines show the expected J 2 values from different internal density models. The undifferentiated model assumes a homogeneous interior along with the occultation-derived shape model (Ortiz et al. 2017). The differentiated model is a two-layer model proposed by Dunham et al. (2019). The posterior shows that both models are consistent with the data, although the differentiated model is slightly disfavored.
Other Images in This Article
Copyright and Terms & Conditions
© 2024. The Author(s). Published by the American Astronomical Society.