Image Details
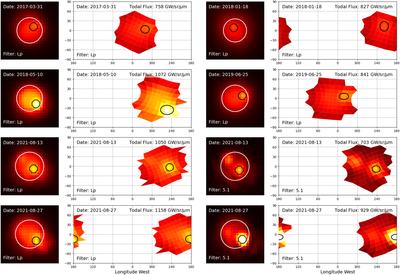
Caption: Figure 7.
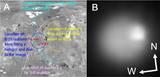
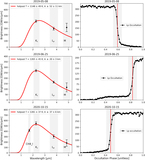
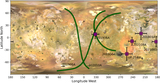
Sunlit IRTF images of Io on several nights that show clear hot spots. The square shift-and-add images are used to constrain the spot location and project each pixel onto the map of Io that is to the right of each image. The heatmap scale is the same for all images. The bottom two rows show Lp (left) and M (right) images from August when both bands are imaged. All circled hot spots are outbursts, except for the upper left panel for 2017 March 31, in which Loki is a mini-outburst.
Other Images in This Article
Copyright and Terms & Conditions
© 2023. The Author(s). Published by the American Astronomical Society.
Copyright ©
2026 Astronomy Image Explorer. All Rights Reserved.