Image Details
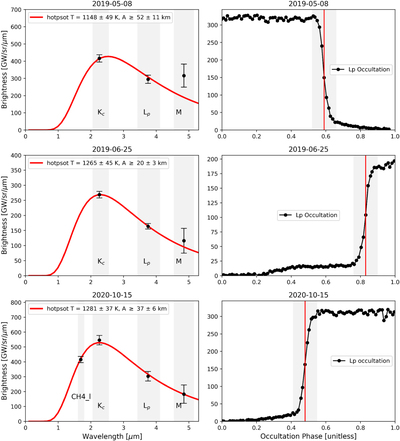
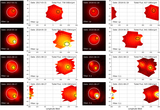
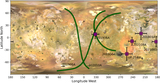
Caption: Figure 6.
Effective temperature and area constraints for the 201905A (top), 201906A (middle), and 202010A (bottom) outburst events. The red curves in the left panels are the blackbody fits of the noncorrected photometric intensity measurements: Lp, Kcont, and CH4_l band (when available). The occultation light curve is the Lprime-band brightness of Io's observable (nonoccluded) surface vs. occultation phase, which is the rescaled time, with zero being the start and 1 being the finish of the occultation. The shaded regions in the left panels indicate the in-band wavelength range, and those in the right panels indicate the transitional phase range of the outbursts.
Other Images in This Article
Copyright and Terms & Conditions
© 2023. The Author(s). Published by the American Astronomical Society.