Image Details
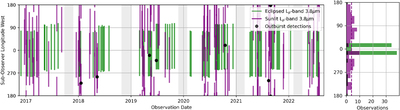
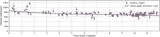
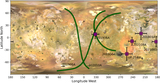
Caption: Figure 3.
Time series of the subobserver (e.g., central meridian) longitude +/− 90° for each of our eclipsed and sunlit observations. The black dots are the subobserver longitudes at the time of each outburst event. The panel on the right is the histogram of the observations divided into 15° sub-Earth longitude bins. The gray shaded regions show the periods of Jupiter's solar conjunction. The eclipsed observations are clustered around the sub-Jovian point at 0° west. The sunlit observations are scattered semi-evenly around Io, with the dashed line showing the average of three sunlit observations per 15° bin (or approximately one per 5° longitude). Note that while we have more observations of the leading hemisphere (centered on 90°W longitude), outbursts favor the trailing hemisphere (centered on 270°W longitude).
Other Images in This Article
Copyright and Terms & Conditions
© 2023. The Author(s). Published by the American Astronomical Society.