Image Details
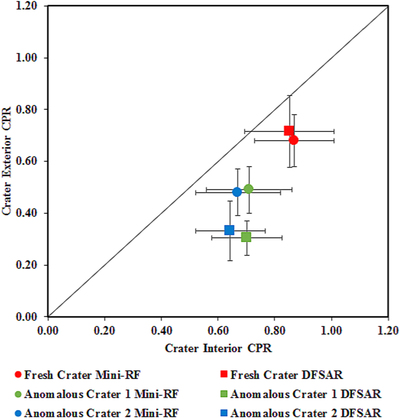
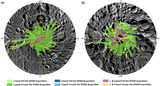
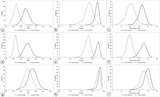
Caption: Figure 12.
Scatter plot of mean CPR values from the interior and exterior regions of two “anomalous” craters and a “normal” fresh crater obtained using S-band Mini-RF and L-band DFSAR quad-pol data. The markers designate data points from the instrument they are collected: DFSAR (squares) and Mini- RF (circles). The colors designate the regions of fresh crater (red), anomalous crater “1” (green), and anomalous crater “2” (blue). Error bars represent one standard deviation of the mean values.
Other Images in This Article
Show More
Copyright and Terms & Conditions
© 2021. The Author(s). Published by the American Astronomical Society.
Copyright ©
2025 Astronomy Image Explorer. All Rights Reserved.