Image Details
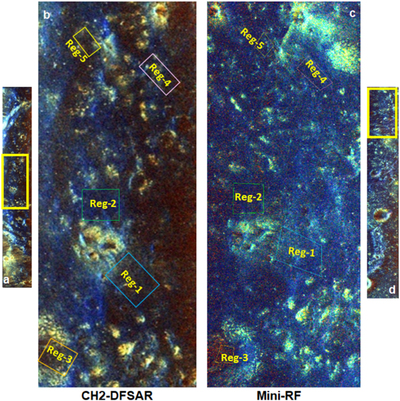
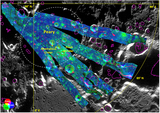
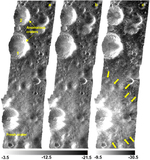
Caption: Figure 3.
Radiometry comparison over five sample regions (indicated by boxes in (b) and (c)) between (a) S-band DFSAR and (d) S-band Mini-RF hybrid-polarimetric data shown here in m-chi decomposition images with the RGB color scheme indicating the dominant scattering regime: even bounce (red), odd bounce (blue), and volume scattering (green). The extent of the zoomed-in portions (b) and (c) are shown with yellow boxes in (a) and (d), respectively. Both DFSAR and Mini-RF images shown here are resampled to a similar spatial resolution (∼30 m pixel−1) and the center coordinates of the DFSAR image in (a) are 35.36°N, 79.54°E.
Other Images in This Article
Show More
Copyright and Terms & Conditions
© 2021. The Author(s). Published by the American Astronomical Society.