

Image Details
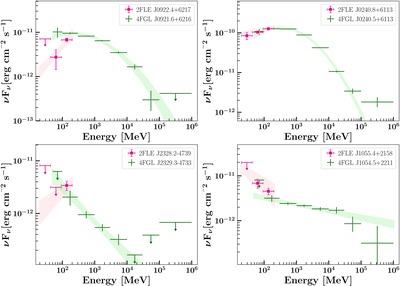
Caption: Figure 19.
Combined 2FLE (pink) and 4FGL (green) spectral energy distributions (SEDs). The shaded bands show the 1σ confidence levels obtained using the best-fit parameters for the sources. Top left: 2FLE J0922.4+6217 associated with FSRQ OK 630 depicts how the 2FLE energy range constrains the location of the peak emission. Top right: HMB LSI +61 303; with the 2FLE, we see the peak is flatter than predicted by the 4FGL model. Bottom left: FSRQ PKS 2326-477 modeled by a power law in the 4FGL. Similar to the example above, the 2FLE enables us to determine the peak of the emission and see the turnover of the slope of the gamma-ray emission. Bottom right: BLL associated with 87 GB 105148.6+222705. Here, we see that an extrapolation of the 4FGL model would predict a much less steep slope than what is found by the 2FLE.
Other Images in This Article
Show More
Copyright and Terms & Conditions
© 2026. The Author(s). Published by the American Astronomical Society.

