

Image Details
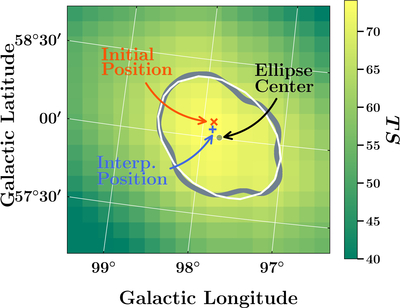
Caption: Figure 4.
Example of the source localization and positional uncertainty region determination using the ΔTS interpolation method (see Section 3.2). The orange cross indicates the initial position of the source identified by fermipy source finding algorithm. The map shown in the background is the TS map around the location of the source (the maximum TS of the source in this map, hence of the color scale, is 74). The blue plus sign marks the new source position found by interpolating the ΔTS map around the peak and defining a subgrid of points finer than the ROI pixel size to locate the true minimum of ΔTS (i.e., true TS maximum). To find the 95% positional uncertainty, we select all of the points from the true minimum for which ΔTS = 5.99 (gray jagged line) and fit them with an ellipse (white line). The center of the ellipse is shown as a gray dot.
Other Images in This Article
Show More
Copyright and Terms & Conditions
© 2026. The Author(s). Published by the American Astronomical Society.

