

Image Details
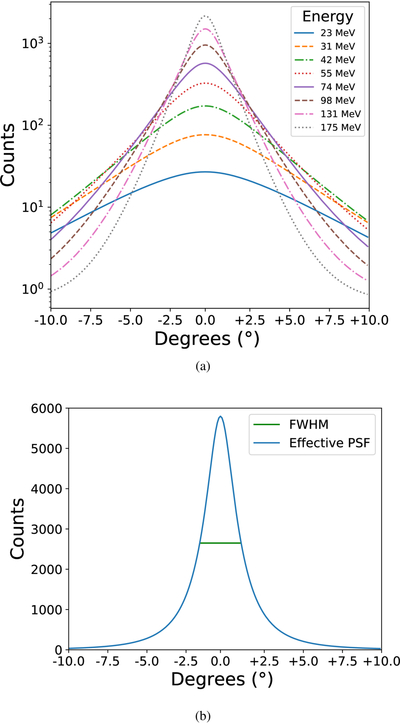
Caption: Figure 3.
Top, (a): 1D slices of the PSF as a function of energy for a simulated source with Γ = 2.0. The y-axis is in log scale. Bottom, (b): sum of all of the slices above representing the effective PSF for a source with Γ = 2.0. The green line represents the FWHM calculated for the effective PSF. The y-axis is in linear scale.
Other Images in This Article

Show More
Copyright and Terms & Conditions
© 2026. The Author(s). Published by the American Astronomical Society.

Copyright ©
2026 Astronomy Image Explorer. All Rights Reserved.
