

Image Details
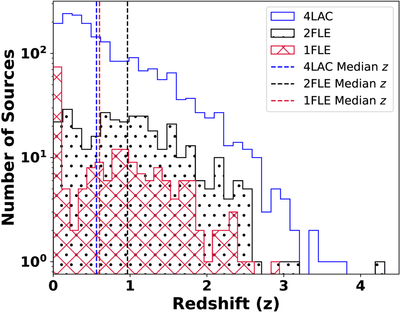
Caption: Figure 14.
Distribution of source redshift in the 4LAC (blue), 2FLE (black, dotted), and 1FLE (red, cross-hatched) with corresponding median values indicated by dashed vertical lines. The 2FLE detects the largest median redshift value and has a flatter distribution of sources detected at 0.6 < z < 1.5 compared to the 1FLE and 4LAC. The dominance of FSRQs in the 2FLE is the primary reason for this difference. The preponderance of FSRQs in the 2FLE is generally due to FSRQs high-energy spectral hump peaking at MeV energies, especially FSRQs at higher z. We note that the z = 4.314 source is also detected in the 4LAC.
Other Images in This Article
Show More
Copyright and Terms & Conditions
© 2026. The Author(s). Published by the American Astronomical Society.

