

Image Details
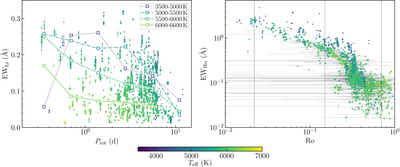
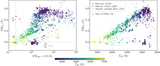
Caption: Figure 6.
The youthfulness and activity of the ROT candidates. Left: distribution of lithium absorption strength as a function of rotation period. The data are color coded by Teff, and the lines show the binned median trends for Teff groups. Right: the Hα emission strength versus the Rossby number. The vertical lines indicate the transition among activity saturation regimes (see Figure 4, upper-right panel).
Other Images in This Article
Copyright and Terms & Conditions
© 2026. The Author(s). Published by the American Astronomical Society.

Copyright ©
2026 Astronomy Image Explorer. All Rights Reserved.
