

Image Details
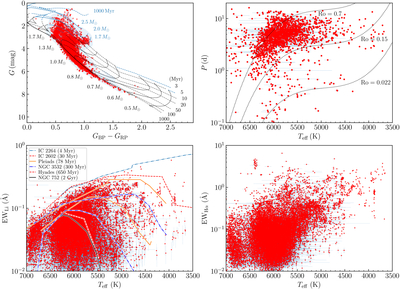
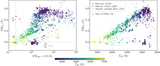
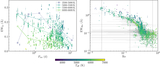
Caption: Figure 4.
Key distributions of the identified aYS candidates. Upper left: the Gaia DR3 CMD of the candidates (points) compared to the background distribution of all LAMOST MRS objects in our selection (blue density contours). Overlaid curves are the PARSEC v1.2 s (A. Bressan et al. 2012) evolutionary tracks (solid lines) and isochrones (dashed lines) for solar metallicity, color coded by ﹩{\mathrm{log}}\,g\leqslant 4﹩ (blue) and > 4 (black), respectively. Upper right: P–Teff diagram. Lines of constant Rossby number (Ro) mark the transition among activity saturation regimes (H. Yang et al. 2025). Lower left: EWLi–Teff diagram. Empirical upper envelopes for several benchmark clusters of different ages are shown for comparison. Lower right: EWHα–Teff diagram.
Other Images in This Article
Copyright and Terms & Conditions
© 2026. The Author(s). Published by the American Astronomical Society.

