

Image Details
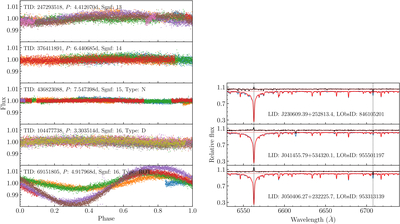
Caption: Figure 2.
Left: examples of phase-folded LCs with different significance (Sgnf, see Equation (1)). Different rotation cycles are highlighted in distinct colors. Right: the corresponding spectral analysis results. For each target, the LAMOST spectrum, VAE template, and residual spectrum + 1.05 are plotted as blue, red, and black lines, respectively, overlaid by horizontal red dotted lines at 1.00 and 1.05 and vertical black dotted lines denoting the Hα and Li I line centers.
Other Images in This Article
Copyright and Terms & Conditions
© 2026. The Author(s). Published by the American Astronomical Society.

Copyright ©
2026 Astronomy Image Explorer. All Rights Reserved.
