

Image Details
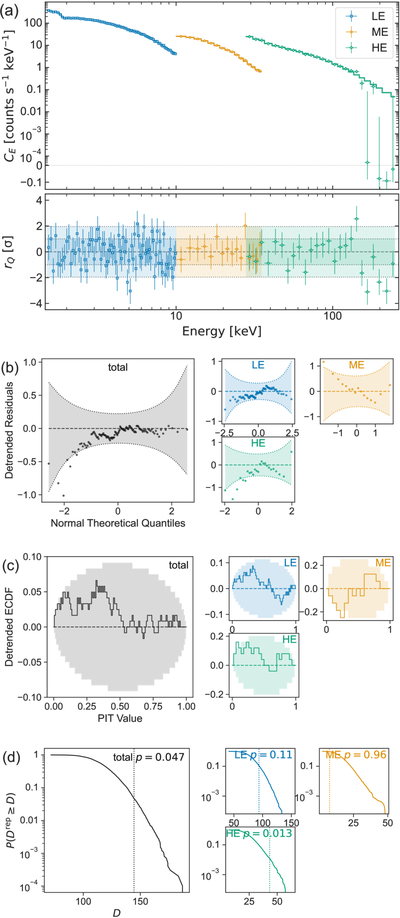
Caption: Figure 4.
Example of spectral fit and residual diagnostics for the HXMT Crab observation (a), and corresponding PSIS-LOO Q–Q (b), PIT (c), and posterior predictive check (d) diagnostics. The shaded area around the reference line in the Q–Q (b) and PIT (c) plots represents the 95% pointwise confidence interval. Systematic deviations outside the confidence interval highlight miscalibration. The detrending removes the linear trend, making it easier to see systematic deviations. The posterior predictive check in panel (d) compares the observed deviance to its posterior predictive distribution from simulated-and-refit replicates and reports a posterior predictive p-value; values near 0 or 1 indicate tension between the data and the fitted model.
Other Images in This Article
Copyright and Terms & Conditions
© 2026. The Author(s). Published by the American Astronomical Society.

