

Image Details
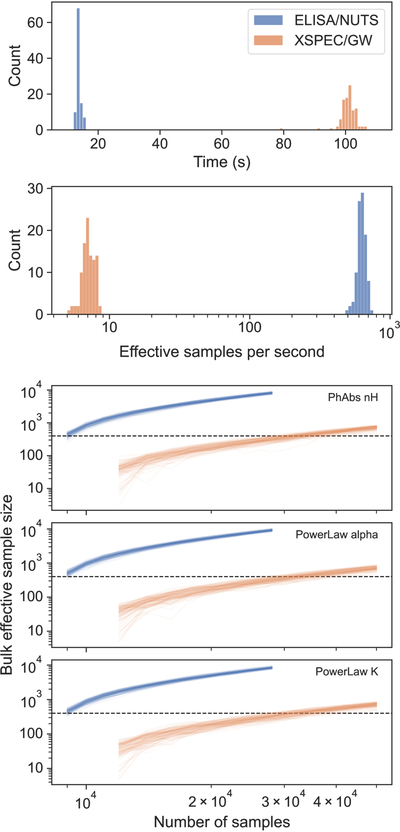
Caption: Figure 3.
Sampling efficiency diagnostics for the HXMT Crab example. Top: distribution of wall-clock sampling times over 100 repeated fits for ELISA/NUTS (blue) and XSPEC/GW (orange). Middle: distribution of effective samples per second of each fit for ELISA/NUTS (blue) and XSPEC/GW (orange). Bottom: bulk ESS as a function of total sample count for the same repeats (one thin line per run); the dashed line marks ESSbulk = 400.
Other Images in This Article
Copyright and Terms & Conditions
© 2026. The Author(s). Published by the American Astronomical Society.

Copyright ©
2026 Astronomy Image Explorer. All Rights Reserved.
