

Image Details
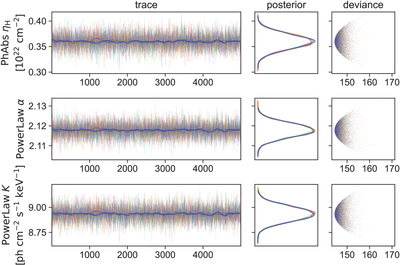
Caption: Figure 2.
Convergence diagnostics for the HXMT Crab example. For each parameter, the left panel shows the post-warm-up trace for the four chains (distinguished by color), together with a dark-blue smoothed running mean as a visual guide; the middle panel shows the marginal posterior density by chain, and the right panel shows the per-draw deviance cloud. Stable traces, overlapping densities, and the absence of systematic drifts or isolated high-deviance excursions indicate good mixing and convergence.
Other Images in This Article
Copyright and Terms & Conditions
© 2026. The Author(s). Published by the American Astronomical Society.

Copyright ©
2026 Astronomy Image Explorer. All Rights Reserved.
