

Image Details
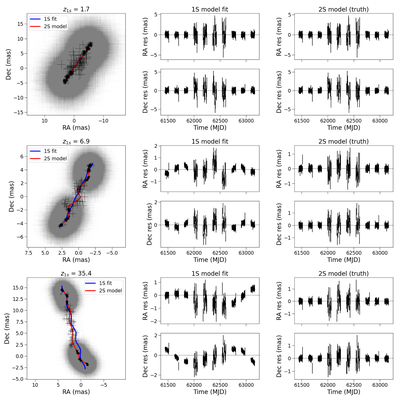
Caption: Figure 6.
Simulated astrometry for three binaries. The left panels show the on-sky trajectories; gray points are individual epoch measurements and black points are those measurements binned to 1 day. The gray points separate into two “clouds” in the middle and bottom panels due to the structure of the GBTDS, as the high-cadence seasons occur at the beginning and end of the survey, with low-cadence seasons in the middle. The red curve traces the true orbital motion; the blue curve shows the best-fit single-star model. The middle (right) panels show the residuals to the single (binary) star model. Top row: star+star binary with z1s = 1.7. Input parameters: Porb = 1251 days, e = 0.68, d = 8.2 kpc (ϖ = 0.12 mas), a = 0.02 mas, a0 = 0.25 mas, F146Vega = 22.2 mag, M1 = 0.44M⊙, M2 = 0.33M⊙, μ = (1.9, −2.7) mas yr−1. Middle row: BH+star binary with z1s = 6.9. Input parameters: Porb = 539 days, e = 0.60, d = 7.6 kpc (ϖ = 0.13 mas), a = 0.43 mas, a0 = 0.41 mas, F146Vega = 18.8 mag, M1 = 0.84M⊙ (star), M2 = 15.1M⊙ (BH), μ = (1.00, −1.99) mas yr−1. Bottom row: BH+star binary with z1s = 35.4. Input parameters: Porb = 1680 days, e = 0.31, d = 4.45 kpc (ϖ = 0.22 mas), a = 1.24 mas, a0 = 1.12 mas, F146Vega = 18.8 mag, M1 = 0.76M⊙ (star), M2 = 7.1M⊙ (BH), μ = (−1.13, −3.56) mas yr−1. The single-star residuals in the z1s = 6.9 and 35.4 examples demonstrate how the single-star model is a poor fit; in the z1s = 1.7 case, the single-star model is an adequate description because the binary signal is not detectable given the uncertainties.
Other Images in This Article
Copyright and Terms & Conditions
© 2026. The Author(s). Published by the American Astronomical Society.

