

Image Details
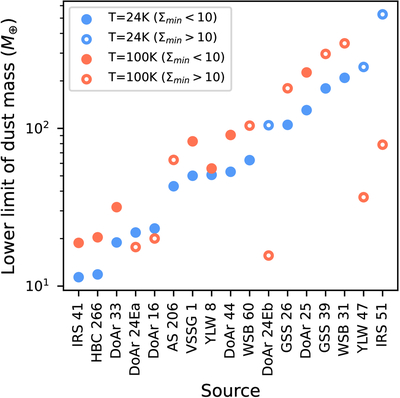
Caption: Figure 5.
Lower limits on the dust masses derived from the observed α200−300 and F250 GHz (for details, see Section 5). Blue and red symbols show the estimates obtained by adopting ﹩({T}_{{\rm{dust}}},{a}_{{\rm{\max }}})﹩ = (24 K, 3 mm) and (100 K, 0.05 mm), respectively. Open circles indicate sources for which the model spectral index does not become lower than the observed α200−300 within the explored range of Σdust; their inferred dust masses therefore correspond to the adopted upper boundary of Σdust and should be interpreted as lower limits. Filled circles indicate sources for which a minimum Σdust is identified within the explored range.
Other Images in This Article
Copyright and Terms & Conditions
© 2026. The Author(s). Published by the American Astronomical Society.

