

Image Details
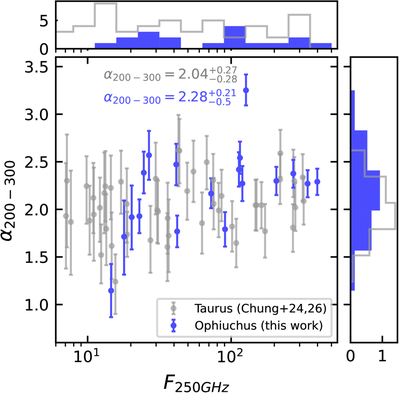
Caption: Figure 3.
The 199–310 GHz spectral index (α200−310) versus 250 GHz flux density (F250GHz). The values of F250GHz have been rescaled to a 140 pc distance, according to the distances of the target sources listed in Table 1. The measurements for Taurus sources were quoted from C.-Y. Chung et al. (2024, 2026). For the faint Taurus sources quoted from C.-Y. Chung et al. (2026), we approximated α200−300 by α198−358 since their observations did not cover the 255–330 GHz frequency. The histograms on the right have been normalized such that the area under each of them is 1.0. From the sample of C.-Y. Chung et al. (2024), we excluded the extended disks, DL Tau, CI Tau, GM Tau, AB Aur, DM Tau, AA Tau, and GO Tau that have relatively large spectral indices, and excluded the sources CoKu Tau 1 and FY Tau due to the poor data quality.
Other Images in This Article
Copyright and Terms & Conditions
© 2026. The Author(s). Published by the American Astronomical Society.

