

Image Details
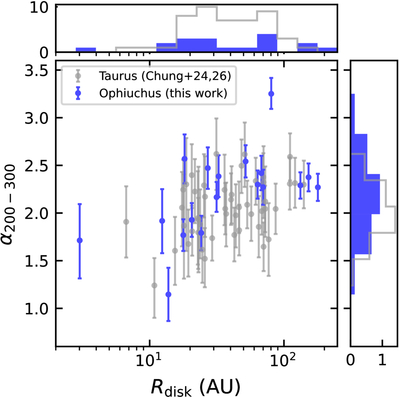
Caption: Figure 4.
The 199–310 GHz spectral index (α200−300) versus disk radius (R95%). The histograms on the right have been normalized such that the area under each of them is 1.0.
Other Images in This Article
Copyright and Terms & Conditions
© 2026. The Author(s). Published by the American Astronomical Society.

Copyright ©
2026 Astronomy Image Explorer. All Rights Reserved.
