

Image Details
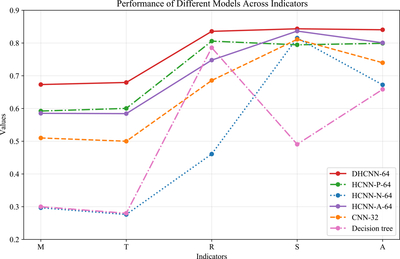
Caption: Figure 9.
Comparative performance of six models across five metrics. This line chart illustrates the (M, T, R, S, A) scores for each model, where a higher value denotes better performance. The models and their line styles are: DHCNN-64 (solid red), HCNN-P-64 (green dashed–dotted), HCNN-N-64 (dotted blue), HCNN-A-64 (solid purple), CNN-32 (dashed orange) and decision tree (pink dashed–dotted).
Other Images in This Article
Copyright and Terms & Conditions
© 2026. The Author(s). Published by the American Astronomical Society.

Copyright ©
2026 Astronomy Image Explorer. All Rights Reserved.
