

Image Details
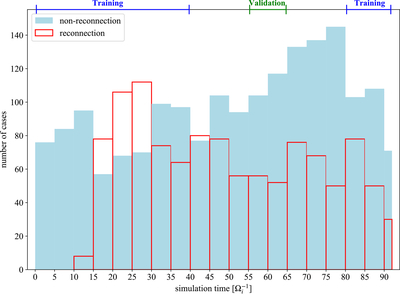
Caption: Figure 5.
Distribution of events and dataset partitioning for SIM1. The total number of events for every five time intervals is shown. The light blue columns represent the number of nonreconnection events, while their red borders represent the number of reconnection events. Meanwhile, the intervals between adjacent blue line segments represent the time periods of the training set, while the intervals between green line segments represent those of the validation set.
Other Images in This Article
Copyright and Terms & Conditions
© 2026. The Author(s). Published by the American Astronomical Society.

Copyright ©
2026 Astronomy Image Explorer. All Rights Reserved.
