

Image Details
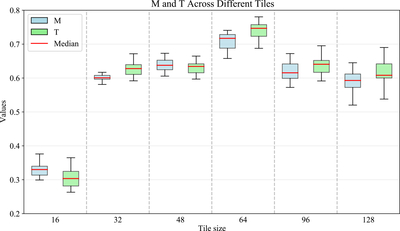
Caption: Figure 8.
Performance comparison across tile sizes. The boxplot compares the distribution of ﹩M﹩ and ﹩T﹩ scores across six different tile sizes. The horizontal axis represents the tile size, and the vertical axis represents the value of the corresponding metric. The light blue boxes correspond to the ﹩M﹩ metric, and the light green boxes to the ﹩T﹩ metric. Each box shows the interquartile range with the red line indicating the median.
Other Images in This Article
Copyright and Terms & Conditions
© 2026. The Author(s). Published by the American Astronomical Society.

Copyright ©
2026 Astronomy Image Explorer. All Rights Reserved.
