

Image Details
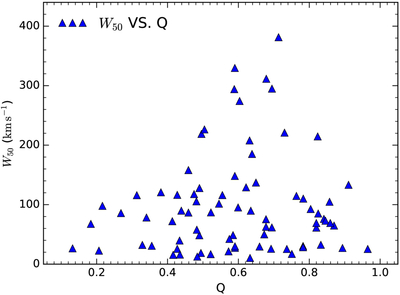
Caption: Figure 7.
Distribution of the H I line width W50 as a function of the axial ratio Q = b/a. Most data points cluster around Q ≈ 0.6–0.7, and the sources with larger W50 are also predominantly located in this same range of Q.
Other Images in This Article
Copyright and Terms & Conditions
© 2026. The Author(s). Published by the American Astronomical Society.

Copyright ©
2026 Astronomy Image Explorer. All Rights Reserved.
