

Image Details
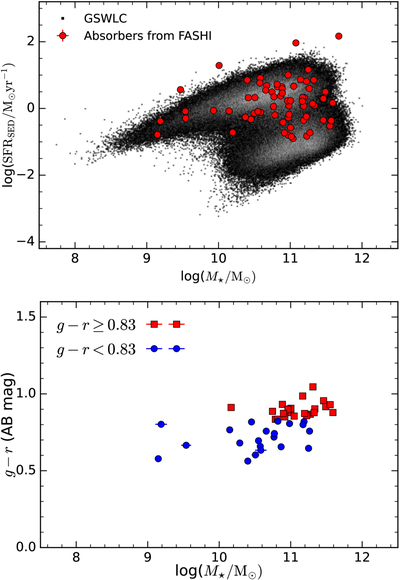
Caption: Figure 5.
Upper: Two-dimensional distributions of star formation rate log(SFRSED) and stellar mass log(M⋆). The background shows all the data in the GSWLC. The red dots indicate crossmatched and associated H I absorbers detected by FASHI. Lower: Color–stellar mass diagram of the FASHI absorbers. The blue and red galaxies are separated by g − r = 0.83 (S. M. Weinmann et al. 2006; X. Yang et al. 2006).
Other Images in This Article
Copyright and Terms & Conditions
© 2026. The Author(s). Published by the American Astronomical Society.

Copyright ©
2026 Astronomy Image Explorer. All Rights Reserved.
