

Image Details
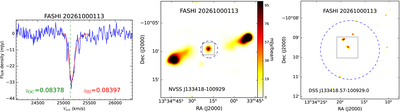
Caption: Figure 2. Spectra and images for FASHI 21 cm H I absorption galaxies
The complete figure set (243 images) is available in the online journal.
H I absorption galaxy ID 20261000113. Left: H I absorption spectrum. The H I redshift measured by FAST (in red) and an optical spectroscopic redshift (in green) are presented in the panel. The red curve is the fit to the spectrum, and the green dashed line is the optical spectroscopic redshift. Middle: The blue circle indicates the position of H I source with a beam size of ∼2﹩\mathop{.}\limits^{{\rm{^{\prime} }}}﹩9. The background shows 1.4 GHz radio continuum distribution. The bright source within a square is the radio counterpart. Right: The background shows a Digitized Sky Survey (DSS) image. The bright source within a square is the DSS counterpart. The other 50 H I absorption galaxies are shown in the online figure set.
Other Images in This Article
Copyright and Terms & Conditions
© 2026. The Author(s). Published by the American Astronomical Society.

