

Image Details
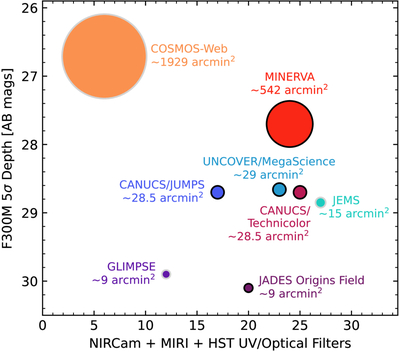
Caption: Figure 6.
Comparison of various deep/wide JWST imaging surveys. The y-axis represents the 5σ depth of the surveys in the F300M filter where available or, if unavailable, an extrapolation to the equivalent depth using the identical exposure time on the nearest broadband filter. Surveys without F300M are plotted with a gray outline. The x-axis shows the typical number of filters with good coverage of the field. The size of the circles represents the total area of the surveys. In terms of surveys with good medium-band coverage (>14 filters), MINERVA occupies the niche as the widest but shallowest medium-band survey.
Other Images in This Article
Show More
Copyright and Terms & Conditions
© 2026. The Author(s). Published by the American Astronomical Society.

