

Image Details
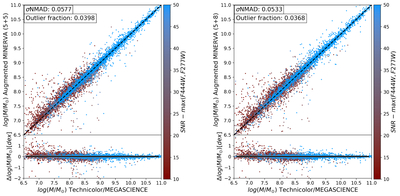
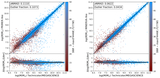
Caption: Figure 5.
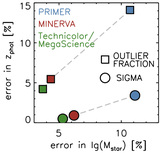
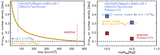
Left panels: stellar mass results from simulating a 10 filter MINERVA survey from UNCOVER/MegaScience and CANUCS/Technicolor to PRIMER/MINERVA depth and including the PRIMER filters (18 JWST filters + 3 HST filters). In this case, MINERVA’s M/M⊙ are estimated to have had a ∼1.19× improvement in σNMAD and 1.23× reduction in outlier fraction (note that the plot and inset statistics are ﹩\mathrm{log}(M/{M}_{\odot )}﹩ but the factors quoted are converted to linear). Right panels: the same simulation but for a MINERVA survey that would include five filters in the SW (four medium bands + F070W) and all eight LW medium bands at simulated MINERVA depth, including PRIMER broad bands (21 JWST filters + 3 HST filters). If the maximum number of medium bands is employed, MINERVA’s stellar masses are estimated to further improve by a factor of 1.47 in σNMAD and 1.51 in outlier fraction. Given that the required observing time increase for each dataset would be a factor of 1.25 and 1.75, respectively, this shows that, like zphot, the improvement in M/M⊙ scales approximately linearly with exposure time.
Other Images in This Article
Show More
Copyright and Terms & Conditions
© 2026. The Author(s). Published by the American Astronomical Society.

