

Image Details
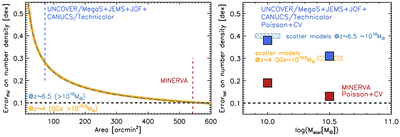
Caption: Figure 10.
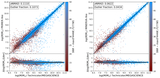
Left: Poisson error versus area for z ∼ 6 galaxies with M⋆ > 1010 M⊙ (blue dashed curve) and z ∼ 4 massive (M⋆ > 1010.5 M⊙) quiescent galaxies (orange curve). The vertical dashed lines show the combined area in current JWST imaging surveys with medium bands (blue) and MINERVA (red). Right: total (Poisson and cosmic variance) error on the number density of z ∼ 6 galaxies with M⋆ > 1010 M⊙ and massive quiescent galaxies at z ∼ 4 with M⋆ > 1010.5 M⊙. Hatched light blue and orange regions show the typical scatter among theoretical model predictions for these populations, respectively. Filled blue squares show the estimated total errors from current JWST imaging surveys with medium bands, while filled red squares show the estimated total errors from the MINERVA survey. MINERVA will allow us to distinguish between different theoretical models of early galaxy evolution, with errors a factor of ∼2–3 smaller than the current scatter between different models.
Other Images in This Article
Show More
Copyright and Terms & Conditions
© 2026. The Author(s). Published by the American Astronomical Society.

