

Image Details
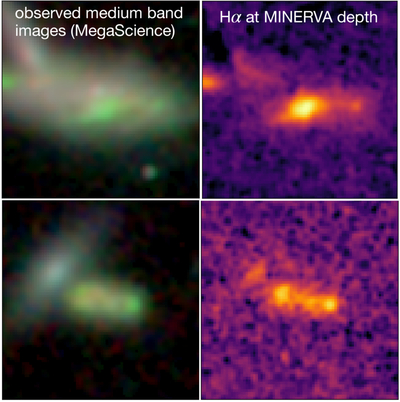
Caption: Figure 12.
Three-color medium-band images of two z ∼ 2.3 galaxies (Hα in green; continuum in blue and red) as well as continuum-subtracted Hα maps following the methods in B. Lorenz et al. (2025). Data are from UNCOVER/MegaScience, with additional noise added to simulate the shallower depth of MINERVA.
Other Images in This Article
Show More
Copyright and Terms & Conditions
© 2026. The Author(s). Published by the American Astronomical Society.

Copyright ©
2026 Astronomy Image Explorer. All Rights Reserved.
