

Image Details
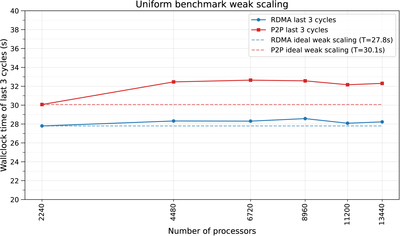
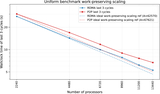
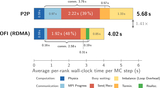
Caption: Figure 8.
Weak-scaling results for the uniform-emission benchmark. Wall-clock time (average of the last three cycle step times) is shown as a function of the number of MPI ranks, with per-core workload held approximately constant (Nbase/P = 5000 cells per core, Δt ∝ P−1/3). The dashed line shows the ideal weak-scaling reference (constant time).
Other Images in This Article

Copyright and Terms & Conditions
© 2026. The Author(s). Published by the American Astronomical Society.

Copyright ©
2026 Astronomy Image Explorer. All Rights Reserved.
