

Image Details
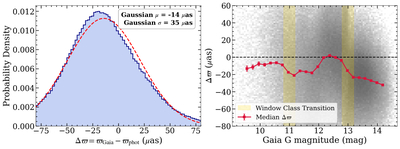
Caption: Figure 5.
Differential calibration of the effective Gaia DR3 parallax offset using the Tier 1 sample. Left: Gaussian fit (red dashed curve) to the parallax residual Δϖ = ϖGaia − ϖphot in the near-field regime d < 4 kpc (blue histogram); the fitted mean is approximately −14 μas. Right: parallax zero-point offset as a function of G magnitude. The gray scales show the stellar density, the red squares and curves represent the binned median values, and the horizontal dashed line marks the zero level.
Other Images in This Article
Copyright and Terms & Conditions
© 2026. The Author(s). Published by the American Astronomical Society.

Copyright ©
2026 Astronomy Image Explorer. All Rights Reserved.
