

Image Details
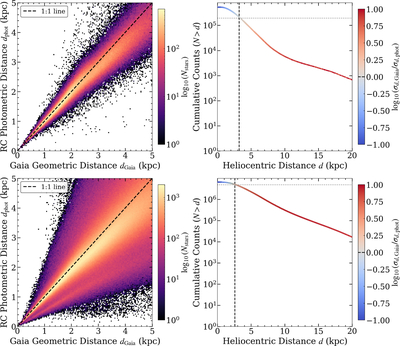
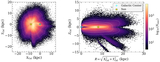
Caption: Figure 4.
Comparison of RC photometric distances with Gaia DR3 geometric parallax distances. Left panels: two-dimensional density distributions of dphot vs. dGaia in the near-field regime d < 5 kpc, for the Tier 1 (top) and Tier 2 (bottom) samples. The black dashed lines mark the 1:1 relation. Right panels: cumulative distributions of RC stars with heliocentric distance, color-coded by ﹩{\mathrm{log}}_{10}({\sigma }_{d,{\rm{Gaia}}}/{\sigma }_{d,{\rm{phot}}})﹩, the logarithm of the ratio of the Gaia geometric-distance uncertainty to the RC photometric-distance uncertainty, for Tier 1 (top) and Tier 2 (bottom). The vertical dashed lines indicate the precision crossover distances, dcross = 3.2 kpc (Tier 1) and dcross = 2.6 kpc (Tier 2).
Other Images in This Article
Copyright and Terms & Conditions
© 2026. The Author(s). Published by the American Astronomical Society.

