

Image Details
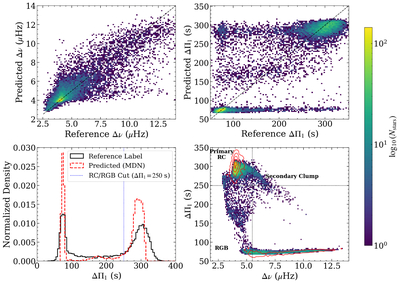
Caption: Figure 1.
MDN prediction performance on the blind-test set. Upper left: two-dimensional density distribution of Δνpred vs. Δνref. Upper right: two-dimensional density distribution of ΔΠ1,pred vs. ΔΠ1,ref. The black dashed lines indicate the 1:1 relation. Lower left: histograms of the predicted (red dashed line) and reference-label (black solid line) ΔΠ1 values. Lower right: two-dimensional density distribution of predicted (color scale) and reference-label (red contour) ΔΠ1 vs. Δν. The positions corresponding to ΔΠ1 = 250 s and Δν = 5.5 μHz are marked.
Other Images in This Article
Copyright and Terms & Conditions
© 2026. The Author(s). Published by the American Astronomical Society.

Copyright ©
2026 Astronomy Image Explorer. All Rights Reserved.
