

Image Details
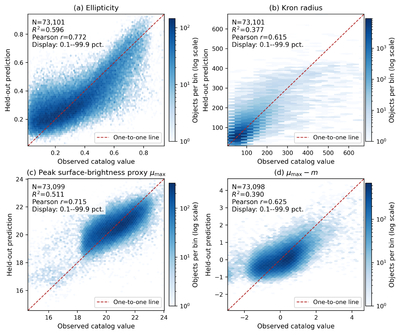
Caption: Figure 3.
Held-out ridge-regression probes of four catalog quantities from the fixed DINOv2 embedding. Hexagonal bins show test-object density on a logarithmic scale; the dashed line is the one-to-one relation. To prevent a small number of extreme catalog values from compressing the visible density, each panel displays the joint 0.1–99.9 percentile range of observed and predicted values; all reported metrics retain the complete held-out sample. Feature standardization and RidgeCV selection use the 80% training partition only. Insets report the held-out sample size, R2, and Pearson r; complete MAE, RMSE, and Spearman ρ values are given in Table 2.
Other Images in This Article
Copyright and Terms & Conditions
© 2026. The Author(s). Published by the American Astronomical Society.

