

Image Details
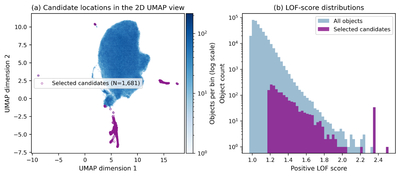
Caption: Figure 6.
Historical LOF–UMAP candidate selection. (a) Logarithmic object density in the same saved two-dimensional UMAP projection described in Section 3.2, with the same 1681 candidates from the original intersection rule overplotted. The projection uses nneighbors = 15, ﹩{\rm{\min }}\_{\rm{dist}}=0.1﹩, the Euclidean metric, and random_state = 42. (b) Positive LOF-score distributions for all objects and selected candidates on a logarithmic count axis. LOF used the raw 384-dimensional embeddings with k = 100 and contamination = 0.1; the secondary filter retained objects beyond the 98th percentile of centroid distance in that saved projection. The visualization documents a configuration-dependent quality-control candidate list, not a complete astrophysical anomaly census.
Other Images in This Article
Copyright and Terms & Conditions
© 2026. The Author(s). Published by the American Astronomical Society.

