

Image Details
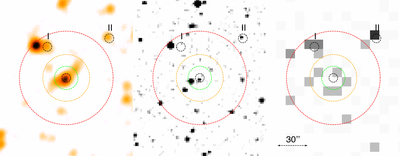
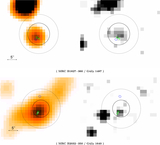
Caption: Figure 2.
Example of regions used to test sources for extent: Infrared, optical, and X-ray maps, matched in scale (north is up and east is to the left) and centered at the position of the X-ray detection for MRC B2032−350 (G4Jy 1640). The infrared map (left side) in the W1 filter (3.4 μm) is from AllWISE; the optical map (center) in the r filter is from DSS2; the X-ray map in the 0.3–10 keV band is from Swift-XRT and is binned by 4 × 4 pixels. The black dotted circles mark the positional uncertainty of the examined X-ray detections, including the unrelated sources marked as I and II (see the text for further details). Three colored circles with radii of five (green), 10 (orange), and 20 (red) pixels (1 pixel = 2﹩\mathop{.}\limits^{^{\prime\prime} }﹩36), respectively, overlay the maps to display the extraction regions (circle C and annulus A) used to evaluate the extent of the X-ray emission, not only for MRC B2032−350 but for all the sources in Table 4.
Other Images in This Article
Copyright and Terms & Conditions
© 2026. The Author(s). Published by the American Astronomical Society.

