

Image Details
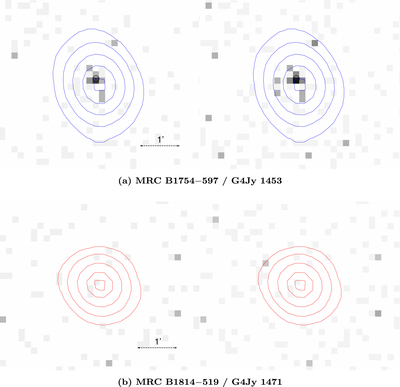
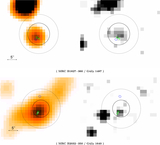
Caption: Figure 1.
X-ray maps (north is up, and east to the left) for MRC B1754−597 (a), MRC B1814−519 (b), MRC B1817−391 (c), MRC B1827−360 (d), and MRC B2032−350 (e). Two maps of the same field of view are given for each source: on the left side, the map in the 0.5–4 keV band; on the right side, the map in the 0.3–10 keV band. Black circles mark the positional uncertainty region for each X-ray detection, computed in the 0.3–10 keV band. All maps, centered at the positions of the SMS4 radio sources, are binned by 4 × 4 pixels. Radio flux-density contours from the SUMSS survey, carried out at 843 MHz, overlay the X-ray maps and have been selected, for each source, to best display the shape of the radio emission. Following Paper I and Paper II, blue contours distinguish sources detected in X-rays by Swift in our campaign from undetected sources, whose contours are marked in red.
Other Images in This Article
Copyright and Terms & Conditions
© 2026. The Author(s). Published by the American Astronomical Society.

